


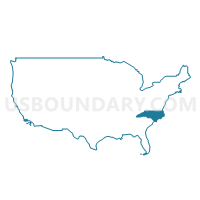
State Senate District 42, North Carolina
About
Outline

Summary
| Unique Area Identifier | 201100 |
| Name | State Senate District 42 |
| State | North Carolina |
| Area (square miles) | 707.97 |
| Land Area (square miles) | 690.55 |
| Water Area (square miles) | 17.42 |
| % of Land Area | 97.54 |
| % of Water Area | 2.46 |
| Latitude of the Internal Point | 35.76692640 |
| Longtitude of the Internal Point | -81.08384270 |
| Total Population | 184,148 |
| Total Housing Units | 80,835 |
| Total Households | 72,490 |
| Median Age | 39.8 |
Maps

Graphs
Select a template below for downloading or customizing gragh for State Senate District 42, North Carolina


Neighbors
Neighoring State Legislative District Upper Chamber (by Name) Neighboring State Legislative District Upper Chamber on the Map
- State Senate District 30, NC
- State Senate District 34, NC
- State Senate District 41, NC
- State Senate District 44, NC
- State Senate District 45, NC
Top 10 Neighboring County (by Population) Neighboring County on the Map
- Iredell County, NC (159,437)
- Catawba County, NC (154,358)
- Burke County, NC (90,912)
- Caldwell County, NC (83,029)
- Lincoln County, NC (78,265)
- Wilkes County, NC (69,340)
- Davie County, NC (41,240)
- Yadkin County, NC (38,406)
- Alexander County, NC (37,198)
Top 10 Neighboring County Subdivision (by Population) Neighboring County Subdivision on the Map
- Hickory township, Catawba County, NC (61,829)
- Davidson township, Iredell County, NC (32,786)
- Newton township, Catawba County, NC (32,264)
- Statesville township, Iredell County, NC (26,460)
- Clines township, Catawba County, NC (24,354)
- Catawba Springs township, Lincoln County, NC (22,548)
- Ironton township, Lincoln County, NC (20,744)
- Lincolnton township, Lincoln County, NC (20,145)
- Lovelady township, Caldwell County, NC (18,000)
- Icard township, Burke County, NC (17,628)
Top 10 Neighboring Place (by Population) Neighboring Place on the Map
- Hickory city, NC (40,010)
- Statesville city, NC (24,532)
- Newton city, NC (12,968)
- St. Stephens CDP, NC (8,759)
- Conover city, NC (8,165)
- Lake Norman of Catawba CDP, NC (7,411)
- Long View town, NC (4,871)
- Bethlehem CDP, NC (4,214)
- Mountain View CDP, NC (3,552)
- Maiden town, NC (3,310)
Top 10 Neighboring Unified School District (by Population) Neighboring Unified School District on the Map
- Iredell-Statesville Schools, NC (131,920)
- Catawba County Schools, NC (104,773)
- Burke County Schools, NC (90,912)
- Caldwell County Schools, NC (83,029)
- Lincoln County Schools, NC (78,265)
- Wilkes County Schools, NC (69,340)
- Davie County Schools, NC (41,240)
- Yadkin County Schools, NC (38,406)
- Alexander County Schools, NC (37,198)
- Hickory City Schools, NC (31,410)
Top 10 Neighboring State Legislative District Lower Chamber (by Population) Neighboring State Legislative District Lower Chamber on the Map
- State House District 95, NC (94,835)
- State House District 97, NC (78,265)
- State House District 79, NC (74,556)
- State House District 89, NC (72,894)
- State House District 96, NC (72,247)
- State House District 85, NC (71,855)
- State House District 94, NC (69,340)
- State House District 87, NC (68,349)
- State House District 92, NC (68,165)
- State House District 88, NC (67,590)
Top 10 Neighboring 111th Congressional District (by Population) Neighboring 111th Congressional District on the Map
Top 10 Neighboring Census Tract (by Population) Neighboring Census Tract on the Map
- Census Tract 102.02, Catawba County, NC (8,365)
- Census Tract 313, Caldwell County, NC (8,094)
- Census Tract 801, Davie County, NC (7,745)
- Census Tract 113, Catawba County, NC (7,187)
- Census Tract 9612, Wilkes County, NC (7,171)
- Census Tract 405, Alexander County, NC (6,982)
- Census Tract 111.02, Catawba County, NC (6,873)
- Census Tract 117.02, Catawba County, NC (6,847)
- Census Tract 504, Yadkin County, NC (6,729)
- Census Tract 407, Alexander County, NC (6,645)
Top 10 Neighboring 5-Digit ZIP Code Tabulation Area (by Population) Neighboring 5-Digit ZIP Code Tabulation Area on the Map
- 28601, NC (50,026)
- 28092, NC (38,570)
- 28625, NC (36,189)
- 28117, NC (35,454)
- 28677, NC (32,940)
- 28602, NC (28,981)
- 28658, NC (27,022)
- 28681, NC (25,910)
- 27028, NC (25,839)
- 28613, NC (22,759)
Data
Demographic, Population, Households, and Housing Units
** Data sources from census 2010 **
Show Data on Map
Download Full List as CSV
Download Quick Sheet as CSV
| Subject | This Area | North Carolina | National |
|---|---|---|---|
| POPULATION | |||
| Total Population Map | 184,148 | 9,535,483 | 308,745,538 |
| POPULATION, HISPANIC OR LATINO ORIGIN | |||
| Not Hispanic or Latino Map | 169,245 | 8,735,363 | 258,267,944 |
| Hispanic or Latino Map | 14,903 | 800,120 | 50,477,594 |
| POPULATION, RACE | |||
| White alone Map | 152,068 | 6,528,950 | 223,553,265 |
| Black or African American alone Map | 14,937 | 2,048,628 | 38,929,319 |
| American Indian and Alaska Native alone Map | 577 | 122,110 | 2,932,248 |
| Asian alone Map | 5,664 | 208,962 | 14,674,252 |
| Native Hawaiian and Other Pacific Islander alone Map | 56 | 6,604 | 540,013 |
| Some Other Race alone Map | 7,570 | 414,030 | 19,107,368 |
| Two or More Races Map | 3,276 | 206,199 | 9,009,073 |
| POPULATION, SEX | |||
| Male Map | 90,446 | 4,645,492 | 151,781,326 |
| Female Map | 93,702 | 4,889,991 | 156,964,212 |
| POPULATION, AGE (18 YEARS) | |||
| 18 years and over Map | 140,323 | 7,253,848 | 234,564,071 |
| Under 18 years | 43,825 | 2,281,635 | 74,181,467 |
| POPULATION, AGE | |||
| Under 5 years | 11,386 | 632,040 | 20,201,362 |
| 5 to 9 years | 12,288 | 635,945 | 20,348,657 |
| 10 to 14 years | 12,501 | 631,104 | 20,677,194 |
| 15 to 17 years | 7,650 | 382,546 | 12,954,254 |
| 18 and 19 years | 4,647 | 277,045 | 9,086,089 |
| 20 years | 2,038 | 141,076 | 4,519,129 |
| 21 years | 1,987 | 136,169 | 4,354,294 |
| 22 to 24 years | 6,050 | 384,328 | 12,712,576 |
| 25 to 29 years | 10,254 | 627,036 | 21,101,849 |
| 30 to 34 years | 11,010 | 619,557 | 19,962,099 |
| 35 to 39 years | 12,970 | 659,843 | 20,179,642 |
| 40 to 44 years | 13,320 | 667,308 | 20,890,964 |
| 45 to 49 years | 14,455 | 698,753 | 22,708,591 |
| 50 to 54 years | 13,743 | 669,893 | 22,298,125 |
| 55 to 59 years | 12,228 | 600,722 | 19,664,805 |
| 60 and 61 years | 4,725 | 222,924 | 7,113,727 |
| 62 to 64 years | 6,880 | 315,115 | 9,704,197 |
| 65 and 66 years | 3,613 | 172,919 | 5,319,902 |
| 67 to 69 years | 4,960 | 230,105 | 7,115,361 |
| 70 to 74 years | 6,328 | 294,543 | 9,278,166 |
| 75 to 79 years | 4,794 | 223,655 | 7,317,795 |
| 80 to 84 years | 3,352 | 165,396 | 5,743,327 |
| 85 years and over | 2,969 | 147,461 | 5,493,433 |
| MEDIAN AGE BY SEX | |||
| Both sexes Map | 39.80 | 37.40 | 37.20 |
| Male Map | 38.80 | 36.00 | 35.80 |
| Female Map | 40.80 | 38.70 | 38.50 |
| HOUSEHOLDS | |||
| Total Households Map | 72,490 | 3,745,155 | 116,716,292 |
| HOUSEHOLDS, HOUSEHOLD TYPE | |||
| Family households: Map | 50,381 | 2,499,174 | 77,538,296 |
| Husband-wife family Map | 37,772 | 1,812,029 | 56,510,377 |
| Other family: Map | 12,609 | 687,145 | 21,027,919 |
| Male householder, no wife present Map | 3,831 | 173,010 | 5,777,570 |
| Female householder, no husband present Map | 8,778 | 514,135 | 15,250,349 |
| Nonfamily households: Map | 22,109 | 1,245,981 | 39,177,996 |
| Householder living alone Map | 18,536 | 1,011,348 | 31,204,909 |
| Householder not living alone Map | 3,573 | 234,633 | 7,973,087 |
| HOUSEHOLDS, HISPANIC OR LATINO ORIGIN OF HOUSEHOLDER | |||
| Not Hispanic or Latino householder: Map | 68,722 | 3,543,727 | 103,254,926 |
| Hispanic or Latino householder: Map | 3,768 | 201,428 | 13,461,366 |
| HOUSEHOLDS, RACE OF HOUSEHOLDER | |||
| Householder who is White alone | 62,755 | 2,704,474 | 89,754,352 |
| Householder who is Black or African American alone | 5,742 | 782,121 | 14,129,983 |
| Householder who is American Indian and Alaska Native alone | 204 | 42,897 | 939,707 |
| Householder who is Asian alone | 1,268 | 64,158 | 4,632,164 |
| Householder who is Native Hawaiian and Other Pacific Islander alone | 21 | 2,003 | 143,932 |
| Householder who is Some Other Race alone | 1,872 | 102,073 | 4,916,427 |
| Householder who is Two or More Races | 628 | 47,429 | 2,199,727 |
| HOUSEHOLDS, HOUSEHOLD TYPE BY HOUSEHOLD SIZE | |||
| Family households: Map | 50,381 | 2,499,174 | 77,538,296 |
| 2-person household Map | 22,584 | 1,099,222 | 31,882,616 |
| 3-person household Map | 11,862 | 597,995 | 17,765,829 |
| 4-person household Map | 9,408 | 475,037 | 15,214,075 |
| 5-person household Map | 4,099 | 206,469 | 7,411,997 |
| 6-person household Map | 1,478 | 75,600 | 3,026,278 |
| 7-or-more-person household Map | 950 | 44,851 | 2,237,501 |
| Nonfamily households: Map | 22,109 | 1,245,981 | 39,177,996 |
| 1-person household Map | 18,536 | 1,011,348 | 31,204,909 |
| 2-person household Map | 3,007 | 188,712 | 6,360,012 |
| 3-person household Map | 362 | 29,440 | 992,156 |
| 4-person household Map | 130 | 11,932 | 411,171 |
| 5-person household Map | 48 | 2,848 | 126,634 |
| 6-person household Map | 18 | 1,042 | 48,421 |
| 7-or-more-person household Map | 8 | 659 | 34,693 |
| HOUSING UNITS | |||
| Total Housing Units Map | 80,835 | 4,327,528 | 131,704,730 |
| HOUSING UNITS, OCCUPANCY STATUS | |||
| Occupied Map | 72,490 | 3,745,155 | 116,716,292 |
| Vacant Map | 8,345 | 582,373 | 14,988,438 |
| HOUSING UNITS, OCCUPIED, TENURE | |||
| Owned with a mortgage or a loan Map | 35,036 | 1,741,905 | 52,979,430 |
| Owned free and clear Map | 17,138 | 755,995 | 23,006,644 |
| Renter occupied Map | 20,316 | 1,247,255 | 40,730,218 |
| HOUSING UNITS, VACANT, VACANCY STATUS | |||
| For rent Map | 2,613 | 156,587 | 4,137,567 |
| Rented, not occupied Map | 94 | 6,671 | 206,825 |
| For sale only Map | 1,350 | 71,693 | 1,896,796 |
| Sold, not occupied Map | 317 | 14,510 | 421,032 |
| For seasonal, recreational, or occasional use Map | 1,534 | 191,508 | 4,649,298 |
| For migrant workers Map | 9 | 1,620 | 24,161 |
| Other vacant Map | 2,428 | 139,784 | 3,652,759 |
| HOUSING UNITS, OCCUPIED, AVERAGE HOUSEHOLD SIZE BY TENURE | |||
| Total: Map | 2.51 | 2.48 | 2.58 |
| Owner occupied Map | 2.54 | 2.52 | 2.65 |
| Renter occupied Map | 2.43 | 2.40 | 2.44 |
| HOUSING UNITS, OCCUPIED, TENURE BY RACE OF HOUSEHOLDER | |||
| Owner occupied: Map | 52,174 | 2,497,900 | 75,986,074 |
| Householder who is White alone Map | 47,294 | 1,988,231 | 63,446,275 |
| Householder who is Black or African American alone Map | 2,798 | 380,844 | 6,261,464 |
| Householder who is American Indian and Alaska Native alone Map | 116 | 27,969 | 509,588 |
| Householder who is Asian alone Map | 858 | 38,608 | 2,688,861 |
| Householder who is Native Hawaiian and Other Pacific Islander alone Map | 9 | 858 | 61,911 |
| Householder who is Some Other Race alone Map | 794 | 38,578 | 1,975,817 |
| Householder who is Two or More Races Map | 305 | 22,812 | 1,042,158 |
| Renter occupied: Map | 20,316 | 1,247,255 | 40,730,218 |
| Householder who is White alone Map | 15,461 | 716,243 | 26,308,077 |
| Householder who is Black or African American alone Map | 2,944 | 401,277 | 7,868,519 |
| Householder who is American Indian and Alaska Native alone Map | 88 | 14,928 | 430,119 |
| Householder who is Asian alone Map | 410 | 25,550 | 1,943,303 |
| Householder who is Native Hawaiian and Other Pacific Islander alone Map | 12 | 1,145 | 82,021 |
| Householder who is Some Other Race alone Map | 1,078 | 63,495 | 2,940,610 |
| Householder who is Two or More Races Map | 323 | 24,617 | 1,157,569 |
| HOUSING UNITS, OCCUPIED, TENURE BY HISPANIC OR LATINO ORIGIN OF HOUSEHOLDER | |||
| Owner occupied: Map | 52,174 | 2,497,900 | 75,986,074 |
| Not Hispanic or Latino householder Map | 50,543 | 2,411,517 | 69,617,625 |
| Hispanic or Latino householder Map | 1,631 | 86,383 | 6,368,449 |
| Renter occupied: Map | 20,316 | 1,247,255 | 40,730,218 |
| Not Hispanic or Latino householder Map | 18,179 | 1,132,210 | 33,637,301 |
| Hispanic or Latino householder Map | 2,137 | 115,045 | 7,092,917 |
| HOUSING UNITS, OCCUPIED, TENURE BY HOUSEHOLD SIZE | |||
| Owner occupied: Map | 52,174 | 2,497,900 | 75,986,074 |
| 1-person household Map | 11,455 | 567,073 | 16,453,569 |
| 2-person household Map | 20,274 | 951,836 | 27,618,605 |
| 3-person household Map | 8,885 | 424,704 | 12,517,563 |
| 4-person household Map | 7,009 | 343,576 | 10,998,793 |
| 5-person household Map | 2,860 | 138,065 | 5,057,765 |
| 6-person household Map | 1,040 | 47,014 | 1,965,796 |
| 7-or-more-person household Map | 651 | 25,632 | 1,373,983 |
| Renter occupied: Map | 20,316 | 1,247,255 | 40,730,218 |
| 1-person household Map | 7,081 | 444,275 | 14,751,340 |
| 2-person household Map | 5,317 | 336,098 | 10,624,023 |
| 3-person household Map | 3,339 | 202,731 | 6,240,422 |
| 4-person household Map | 2,529 | 143,393 | 4,626,453 |
| 5-person household Map | 1,287 | 71,252 | 2,480,866 |
| 6-person household Map | 456 | 29,628 | 1,108,903 |
| 7-or-more-person household Map | 307 | 19,878 | 898,211 |
Loading...